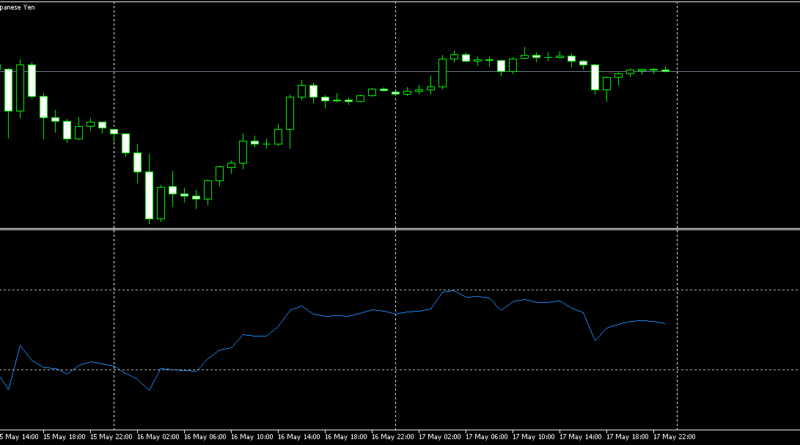
Mastering the RSI indicator for effective trading
Introduction
Brief overview of the RSI indicator
The Relative Strength Index (RSI) is a momentum oscillator used in technical analysis to measure the speed and change of price movements. Developed by J. Welles Wilder Jr., it is widely utilized to identify overbought or oversold conditions in a market, helping traders to predict potential price reversals.
Importance of the RSI indicator
The RSI is crucial for traders because it offers a quantitative basis for assessing market conditions. By providing clear buy and sell signals, the RSI aids traders in making informed decisions, thereby enhancing their trading strategies and improving their chances of success.
Understanding the RSI indicator
RSI definition and purpose
The RSI is an oscillator that ranges from 0 to 100, offering insights into the relative strength or weakness of a security’s price action. Its primary purpose is to indicate whether a stock or asset is being overbought or oversold, thereby signaling potential reversal points.
Historical background and development by J. Welles Wilder Jr.
The RSI was introduced in Wilder’s 1978 book, “New Concepts in Technical Trading Systems.” Wilder’s pioneering work laid the foundation for many modern technical analysis tools, with the RSI becoming one of the most popular due to its simplicity and effectiveness.
How RSI works
Concept of overbought and oversold conditions
The RSI helps traders identify when a security is overbought (typically when the RSI is above 70) or oversold (typically when the RSI is below 30). These conditions suggest that a price correction might be imminent.
Interpretation of RSI values (0-100 Scale)
- 0-30: Indicates oversold conditions, recommending a potential buying opportunity.
- 30-70: Represents a neutral zone where the market is considered balanced.
- 70-100: Indicates overbought conditions, recommending a potential selling opportunity.
By understanding these key RSI levels, traders can better time their entries and exits in the market, leading to more profitable trades.
RSI indicator formula
Calculation of RSI
Mathematical formula for RSI:
𝑅𝑆𝐼=100−(1001+𝑅𝑆)
Explanation of RS (Relative Strength):
𝑅𝑆=Average Gain over n periodsAverage Loss over n periods
Step-by-step calculation
-
Calculate the average gain and average loss over the look-back period (commonly 14 days).
- Average Gain = Sum of gains over the look-back period / n
- Average Loss = Sum of losses over the look-back period / n
-
Calculate the relative strength (RS).
- RS = Average Gain / Average Loss
-
Calculate the RSI.
- RSI = 100 – (100 / (1 + RS))
Example calculation with a hypothetical dataset
- Suppose the look-back period is 14 days.
- If the average gain over this period is 1.5 and the average loss is 0.5:
- RS = 1.5 / 0.5 = 3
- RSI = 100 – (100 / (1 + 3)) = 100 – 25 = 75
Importance of the look-back period (Commonly 14 days)
The 14-day period is the default setting recommended by Wilder. It provides a balanced view of price movements, though it can be adjusted to suit different trading strategies and market conditions.
RSI Indicator settings
Default settings
- Standard period setting: 14 days.
- Typical overbought Level: 70.
- Typical oversold Level: 30.
Customizing settings
Adjusting the look-back period for different trading styles
- Short-term trading: A shorter period (e.g., 7 days) for more responsive signals.
- Long-term trading: A longer period (e.g., 21 days) for more stable signals.
Fine-tuning overbought and oversold levels based on market conditions
- High volatility markets: Adjusting levels to 80 (overbought) and 20 (oversold) can help filter out false signals.
- Low volatility markets: Adjusting levels to 60 (overbought) and 40 (oversold) can help capture more subtle movements.
Examples of settings
- Stocks: Typically stick to the default settings of 14, 70, and 30.
- Forex: May adjust to 9, 80, and 20 due to higher volatility.
- Cryptocurrencies: Often use 7, 80, and 20 given their extreme volatility.

