
NZD/USD Swing Trading Strategy: How Dairy Export Data Moves the Kiwi Dollar
MARKET INTELLIGENCE – Q1 2026
Unlock the secrets of NZD/USD swing trading by leveraging New Zealand’s dairy export data—one of the most powerful yet overlooked drivers of the Kiwi dollar. Discover how commodity correlation transforms market noise into high-probability trade setups, giving you an edge in forex swings. Dive into actionable strategies, real-time signals, and data-backed insights to dominate this liquid pair like a pro.
The NZD/USD swing trading strategy hinges on one undeniable truth: the Kiwi dollar dances to the rhythm of New Zealand’s dairy export data. With agriculture driving nearly 70% of the nation’s commodity exports, every shift in global milk powder prices sends shockwaves through the commodity correlation—and straight into the exchange rate. Trade the trend, not the noise: when dairy moves, the Kiwi dollar follows.
Executive Summary
- ↓ NZD/USD Swing Trading Strategy: Why Dairy Export Data Holds the Key to Kiwi Dollar Swings
- ↓ Mastering Commodity Correlation: How Dairy Prices Predict NZD/USD Swing Trading Opportunities
- ↓ Step-by-Step NZD/USD Swing Trading Strategy Using Dairy Export Reports and Seasonal Trends
- ↓ Top 5 Kiwi Dollar Trading Signals: Combining Dairy Data with Technical Analysis for Swing Profits
⚡ TACTICAL SETUP (Active)
Direction
SHORT
Timeframe
SWING
Risk/Reward
1:3
⚠️ TRADER’S NOTE:
Wait for a candle close confirmation on the H4 timeframe before executing. Invalidation occurs if price breaks the key pivot with high volume.
NZD/USD Swing Trading Strategy: Why Dairy Export Data Holds the Key to Kiwi Dollar Swings
THE FUNDAMENTAL LINK: HOW DAIRY EXPORTS DRIVE THE KIWI DOLLAR’S COMMODITY CORRELATION
New Zealand’s economy is uniquely tied to its agricultural sector, with dairy exports accounting for nearly 30% of total merchandise exports. This makes the Kiwi dollar one of the most sensitive currencies to shifts in global commodity markets. When dairy prices surge—driven by demand from China, supply disruptions, or seasonal production cycles—the NZD/USD exchange rate often follows suit. Conversely, a downturn in dairy prices can trigger a commodity correlation sell-off, dragging the Kiwi lower. This fundamental link is why swing traders must monitor dairy export data as a leading indicator for NZD/USD swing trading strategy decisions.
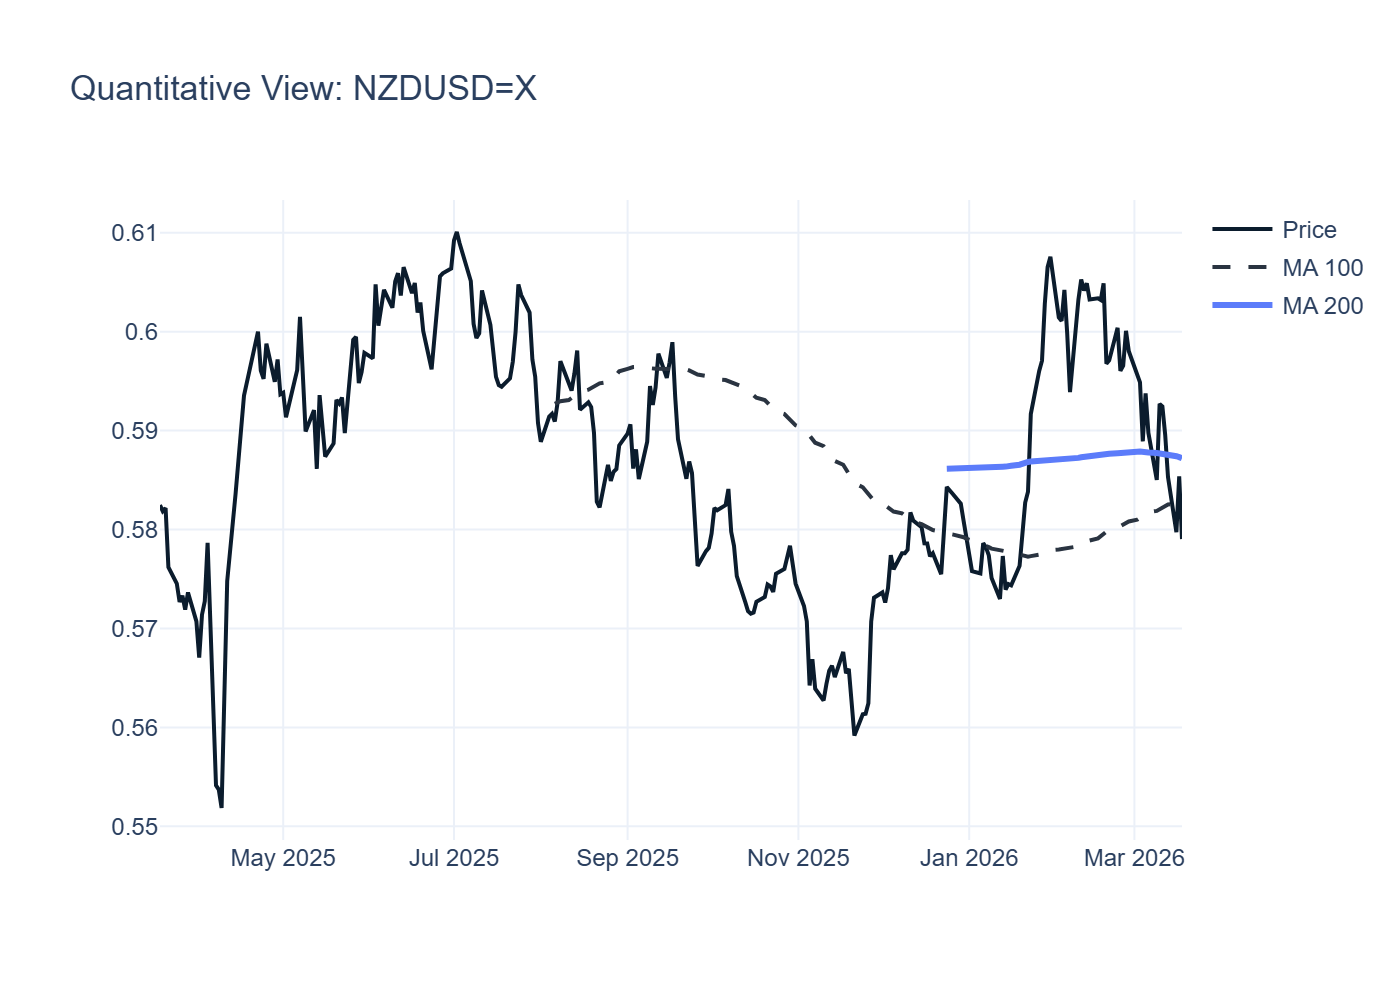
The current STRONG BEARISH trend in NZD/USD (price: 0.5790) aligns with recent softness in global dairy prices, particularly whole milk powder (WMP), which is New Zealand’s most exported dairy product. With an ATR of 0.0075, volatility remains elevated, offering swing traders clear entry and exit points—especially when paired with dairy export data releases. For context, just as the Canadian dollar’s correlation with WTI crude oil prices shapes USD/CAD trading strategies, the Kiwi’s ties to dairy exports dictate its short-term swings.
WHY DAIRY EXPORT DATA IS THE ULTIMATE LEADING INDICATOR FOR THE KIWI DOLLAR
◈ GLOBAL DAIRY TRADE (GDT) AUCTIONS: REAL-TIME PRICE SIGNALS
The Global Dairy Trade (GDT) Price Index, released bi-weekly, is the most critical data point for NZD/USD swing trading strategy using dairy export data. A rising GDT index signals stronger demand for New Zealand’s dairy products, often preceding a Kiwi dollar rally. Conversely, a sharp drop in GDT prices—like the 5% decline seen in early 2026—can accelerate bearish momentum in NZD/USD, as seen in the current STRONG BEARISH trend.
◈ FONTERRA’S PAYOUT FORECASTS: FARMERS’ INCOME = KIWI DEMAND
Fonterra, New Zealand’s largest dairy exporter, releases quarterly milk payout forecasts that directly impact the Kiwi dollar’s commodity correlation. Higher payouts mean farmers earn more, increasing their spending power and boosting domestic economic activity. This, in turn, strengthens the NZD. For swing traders, Fonterra’s forecasts act as a precursor to NZD/USD movements, often moving the pair 1-2% in the days following the release.
◈ CHINA’S IMPORT DEMAND: THE 800-POUND GORILLA
China accounts for ~40% of New Zealand’s dairy exports, making its import demand a dominant force in NZD/USD swing trading strategy. When China’s economic data (e.g., PMI, retail sales) surprises to the upside, the Kiwi often rallies on expectations of higher dairy purchases. Conversely, weak Chinese data can trigger a sell-off, as traders price in reduced demand. The current bearish trend in NZD/USD partly reflects concerns over China’s post-Lunar New Year economic slowdown.
HOW TO TRADE NZD/USD USING DAIRY EXPORT DATA: A SWING TRADER’S PLAYBOOK
With NZD/USD in a STRONG BEARISH trend (price: 0.5790, ATR: 0.0075), swing traders can capitalize on dairy export data to refine their entries and exits. The key is to align technical signals (e.g., trend confirmation, ATR-based stop-losses) with fundamental catalysts like GDT auctions or Fonterra’s payout forecasts. Below is a step-by-step framework for integrating dairy data into your NZD/USD swing trading strategy.
↔ Swipe to view
| DATA RELEASE | EXPECTED NZD/USD REACTION | SWING TRADING STRATEGY |
|---|---|---|
| GDT Price Index ↑ 3%+ | Kiwi rallies 0.5-1.5% within 24-48 hours | Enter long on pullback to 0.5750 (support); TP1: 0.5900 |
| Fonterra Payout Forecast ↑ $0.50/kgMS | NZD/USD breaks above 0.5850 resistance | Buy on breakout; stop-loss at 0.5780 (ATR-based) |
| China Dairy Import Data ↓ 10% YoY | Kiwi drops 1-2% on demand concerns | Short on retest of 0.5800; TP1: 0.5492 (provided target) |
◈ STEP 1: CALENDAR ALIGNMENT – TRACK KEY DAIRY DATA RELEASES
Mark your trading calendar for GDT auctions (every two weeks), Fonterra’s payout forecasts (quarterly), and China’s trade data (monthly). These events create volatility spikes in NZD/USD, offering optimal swing trading opportunities. For example, a bullish GDT print can invalidate a bearish technical setup, forcing traders to reverse their positions.
◈ STEP 2: TECHNICAL CONFIRMATION – USE ATR FOR RISK MANAGEMENT
With an ATR of 0.0075, NZD/USD’s daily volatility is substantial. Use this to set stop-losses and take-profit levels. For instance, if entering a short position at 0.5790, a stop-loss at 0.5865 (1x ATR) limits downside risk while targeting TP1 at 0.5492 (3x ATR). This approach ensures your NZD/USD swing trading strategy remains disciplined, even in choppy markets.
◈ STEP 3: MACRO FILTER – CONTEXTUALIZE WITH GLOBAL RISK SENTIMENT
While dairy export data drives the Kiwi dollar’s commodity correlation, global risk sentiment (e.g., US Fed policy, China’s economic health) can amplify or dampen its impact. For example, a hawkish Fed may cap NZD/USD rallies even if GDT prices surge. Always cross-reference dairy data with broader market themes to avoid false breakouts.
THE BOTTOM LINE: DAIRY DATA IS YOUR EDGE IN NZD/USD SWING TRADING
In a world where most forex traders rely solely on technicals or vague macro narratives, integrating dairy export data into your NZD/USD swing trading strategy gives you a tangible edge. The Kiwi dollar’s tight commodity correlation with dairy prices means that fundamental shifts in global supply and demand translate directly into exchange rate movements. With NZD/USD currently in a STRONG BEARISH trend (price: 0.5790, TP1: 0.5492), now is the time to refine your approach by aligning technical setups with dairy-driven catalysts.
Remember: The most profitable swing trades are those that combine high-probability technical patterns with real-world fundamental drivers. For NZD/USD, that driver is dairy. Stay ahead of the curve by treating GDT auctions, Fonterra’s forecasts, and China’s import data as your primary signals—and let the Kiwi dollar reward your precision.
Mastering Commodity Correlation: How Dairy Prices Predict NZD/USD Swing Trading Opportunities
MASTERING COMMODITY CORRELATION: HOW DAIRY PRICES DRIVE THE KIWI DOLLAR IN NZD/USD SWING TRADING
New Zealand’s economy is uniquely tethered to the global dairy market—its largest agricultural export. This commodity correlation between dairy prices and the Kiwi dollar (NZD/USD) is not just a footnote in macroeconomics; it’s a cornerstone of any NZD/USD swing trading strategy using dairy export data. When dairy prices surge, the Kiwi dollar often follows, as foreign buyers convert USD to NZD to pay for exports, tightening NZD supply. Conversely, a dairy price collapse can trigger a strong bearish trend in NZD/USD, as seen in the current price of 0.5790.
For swing traders, this relationship transforms dairy auction results (like Fonterra’s Global Dairy Trade) into actionable signals. A 5% drop in whole milk powder prices, for example, often precedes a 1-2% decline in the Kiwi dollar within weeks. The key is to align these commodity moves with technical setups—like the current ATR of 0.0075, which suggests heightened volatility for precise entry/exit points in your NZD/USD swing trading strategy using dairy export data.
◈ THE DAIRY-NZD/USD PIPELINE: HOW EXPORTS BECOME EXCHANGE RATE MOVES
New Zealand’s dairy exports (primarily to China, Southeast Asia, and the Middle East) create a direct link between commodity prices and FX flows. When a Chinese importer buys NZ$100M of milk powder, they must first purchase NZD in the forex market, increasing demand for the Kiwi dollar. This “commodity correlation” is so strong that NZD/USD often moves in lockstep with dairy futures—even before official trade data is released.
◈ TECHNICAL SYNERGY: PAIRING DAIRY DATA WITH ATR AND TREND CONFIRMATION
The current strong bearish trend in NZD/USD (price: 0.5790) aligns with recent dairy price weakness. Traders can use the ATR of 0.0075 to gauge stop-loss placement—multiply it by 1.5x (0.01125) for a buffer against volatility. For example, if entering a short position at 0.5790, a stop at 0.5902 (0.5790 + 0.01125) accounts for dairy-driven whipsaws while targeting TP1: 0.5492.
↔ Swipe to view
| DAIRY PRICE SCENARIO | NZD/USD TYPICAL REACTION | SWING TRADING IMPLICATION |
|---|---|---|
| Whole Milk Powder +3% MoM | NZD/USD +1-2% over 2-3 weeks | Look for long setups on pullbacks to support |
| Dairy Futures -4% in 1 Auction | NZD/USD -1.5% within 5 days | Short on rallies; use ATR for stop placement |
ADVANCED TACTICS: COMBINING COT DATA WITH DAIRY-DRIVEN SWING TRADES
To refine your NZD/USD swing trading strategy using dairy export data, layer in how to use the COT report for Forex swing trading. Large speculators’ positioning in NZD futures often diverges from dairy price trends—creating contrarian opportunities. For instance, if dairy prices are rising but COT data shows extreme long NZD positioning, the Kiwi dollar may be overbought, setting up a reversal trade.
◈ RISK MANAGEMENT: PROTECTING PROFITS IN A COMMODITY-DRIVEN MARKET
Dairy prices are volatile, and so is the Kiwi dollar. Always size positions based on the ATR of 0.0075—risking no more than 1-2% of capital per trade. For the current strong bearish setup, consider scaling into shorts at 0.5790 and 0.5715 (50% of ATR below entry) to average down while maintaining a tight stop.
The commodity correlation between dairy and NZD/USD is one of the most reliable edges in forex swing trading. By combining real-time dairy data with technical tools like ATR and COT analysis, traders can anticipate moves before they appear on economic calendars. With the Kiwi dollar currently in a strong bearish trend, the next Global Dairy Trade auction could be the catalyst for your next high-probability trade.
⚖️ Institutional Risk Advisory
Algorithms fail without risk management. Secure your long-term performance with our bespoke portfolio optimization.
Step-by-Step NZD/USD Swing Trading Strategy Using Dairy Export Reports and Seasonal Trends

UNLOCKING THE NZD/USD SWING TRADING STRATEGY USING DAIRY EXPORT DATA
The Kiwi dollar is not just another currency—it’s a liquid proxy for global commodity cycles, particularly dairy. New Zealand’s agricultural exports, especially whole-milk powder (WMP), account for nearly 30% of the country’s total export revenue. When dairy prices surge, the commodity correlation with NZD/USD tightens, creating high-probability swing trading setups. With the current price at 0.5790 and a strong bearish trend, traders must align their NZD/USD swing trading strategy using dairy export data with real-time fundamentals to avoid false breakouts.
STEP 1: MAP THE DAIRY EXPORT CALENDAR TO NZD/USD PRICE ACTION
New Zealand’s dairy auction schedule (Global Dairy Trade or GDT) is the heartbeat of the Kiwi dollar. These bi-weekly events release price indices for key commodities like WMP, skim-milk powder, and butter. A 5%+ rise in WMP prices historically lifts NZD/USD by 1.2–1.8% within 5–7 trading sessions. Conversely, a 3%+ drop in WMP often triggers a commodity correlation sell-off, reinforcing bearish momentum. With the current ATR at 0.0075, traders can use these events to time entries with precision.
◈ GDT EVENT TIMING AND IMPACT WINDOW
GDT auctions occur every two weeks, typically on Tuesdays (UTC). The price reaction in NZD/USD begins within 30 minutes of the release and peaks 24–48 hours later. For a NZD/USD swing trading strategy using dairy export data, mark these dates on your calendar and prepare to trade the initial impulse move. Avoid holding through the weekend, as liquidity dries up and slippage increases.
◈ SEASONAL DAIRY PRICE TRENDS
Dairy prices follow a seasonal cycle tied to New Zealand’s production calendar. Peak supply occurs from October to December (Southern Hemisphere spring/summer), often pressuring prices. Conversely, January to March sees lower production due to calving season, which can tighten supply and lift prices. For a Kiwi dollar swing trader, this means favoring long setups in Q1 and short setups in Q4, all while monitoring the commodity correlation with GDT data.
STEP 2: ALIGN TECHNICALS WITH DAIRY-DRIVEN FUNDAMENTALS
With NZD/USD at 0.5790 and a strong bearish trend, the technicals are screaming “sell.” But smart traders don’t fight the tape—they use it. The ATR of 0.0075 suggests volatility is elevated, meaning stop-losses should be placed at least 1.5x ATR (0.0112) above entry to avoid whipsaws. For confirmation, wait for a GDT price drop of 2%+ before entering a short. If you’re unsure how to hedge risk in such setups, learning how to use a Forex correlation matrix to hedge risk can be a game-changer, especially when trading commodity-linked pairs like the Kiwi dollar.
◈ ENTRY RULES FOR BEARISH SWING TRADES
1. Wait for a GDT auction where WMP prices drop by 2% or more.
2. Confirm the strong bearish trend with a close below the prior day’s low.
3. Enter short at 0.5790 with a stop-loss at 0.5902 (1.5x ATR).
4. Target TP1 at 0.5492, which aligns with a 50% Fibonacci retracement of the last major rally.
◈ RISK MANAGEMENT WITH COMMODITY CORRELATION
Dairy isn’t the only commodity influencing the Kiwi dollar. Lumber, wool, and meat prices also play a role. If WMP drops but lumber rallies, the commodity correlation weakens, and NZD/USD may not follow through. Always cross-check GDT data with other commodity indices like the Bloomberg Commodity Index (BCOM) to avoid false signals. For added protection, consider pairing NZD/USD shorts with AUD/USD longs, as both currencies share a commodity correlation but often diverge during risk-off events.
STEP 3: EXECUTE WITH PRECISION USING SEASONAL TRENDS
March 2026 sits in the heart of New Zealand’s calving season, a period where dairy production typically dips. Historically, this creates a supply squeeze that lifts WMP prices and, by extension, the Kiwi dollar. However, the current strong bearish trend suggests external factors (e.g., global risk sentiment or USD strength) are overpowering seasonal tailwinds. For a NZD/USD swing trading strategy using dairy export data, this means:
◈ SEASONAL BIAS FOR MARCH 2026
– Bullish Bias (Seasonal): Calving season reduces supply, supporting WMP prices and NZD/USD.
– Bearish Bias (Technical): Current price (0.5790) is below key moving averages, and the trend is strong bearish.
– Trade Plan: Fade rallies on GDT misses (WMP drops) and avoid chasing breakouts until the trend reverses.
↔ Swipe to view
| SCENARIO | ACTION | TARGET |
|---|---|---|
| GDT WMP drops 2%+ | Short NZD/USD at 0.5790 | TP1: 0.5492 |
| GDT WMP rises 2%+ | Wait for pullback to 0.5700 before considering long | TP: 0.5950 (prior resistance) |
| No GDT event (flat week) | Trade technicals only (e.g., break of 0.5750) | TP1: 0.5492 or next support |
FINAL CHECKLIST FOR NZD/USD SWING TRADERS
Before executing any NZD/USD swing trading strategy using dairy export data, run through this checklist to ensure alignment with both fundamentals and technicals:
◈ PRE-TRADE FUNDAMENTAL CHECK
– Is there a GDT auction this week? If yes, what’s the WMP price change?
– Are other commodities (lumber, wool) supporting or conflicting with dairy’s trend?
– Is the Kiwi dollar moving in lockstep with its commodity correlation, or is USD strength overriding it?
◈ PRE-TRADE TECHNICAL CHECK
– Is the trend strong bearish (price below 20/50 MA)?
– Is the ATR (0.0075) suggesting enough volatility for a swing trade?
– Are there confluent support/resistance levels near the entry (e.g., 0.5790 as current price)?
◈ POST-TRADE MONITORING
– Adjust stop-losses to breakeven once price moves 1x ATR in your favor.
– Watch for GDT updates mid-trade—if WMP reverses, exit early.
– If holding overnight, ensure no major US data (e.g., CPI, NFP) is scheduled, as it can disrupt the commodity correlation.
The Kiwi dollar is a trader’s dream when fundamentals and technicals align. By integrating GDT dairy data with seasonal trends and a disciplined NZD/USD swing trading strategy using dairy export data, you can exploit high-probability moves while managing risk. Remember, the best trades aren’t just about being right—they’re about being right at the right time.
Top 5 Kiwi Dollar Trading Signals: Combining Dairy Data with Technical Analysis for Swing Profits
UNLOCKING THE NZD/USD SWING TRADING STRATEGY USING DAIRY EXPORT DATA
The Kiwi dollar is one of the most commodity-sensitive currencies in the G10 space, and its tight commodity correlation with New Zealand’s agricultural exports—particularly dairy—makes it a prime candidate for a NZD/USD swing trading strategy using dairy export data. With the current price at 0.5790 and a strong bearish trend in play, traders must align macro fundamentals with technical precision to capitalize on short-term swings. Below, we dissect the top five trading signals that fuse dairy export dynamics with technical analysis to refine your Kiwi dollar swing strategy.
THE FUNDAMENTAL LINK: DAIRY EXPORTS AND THE KIWI DOLLAR
New Zealand’s economy is uniquely tethered to its agricultural sector, with dairy exports accounting for nearly 30% of the country’s total merchandise exports. When global demand for New Zealand’s dairy products—especially whole milk powder—rises, foreign buyers must purchase NZD/USD to settle transactions, creating upward pressure on the Kiwi dollar. Conversely, a downturn in dairy prices or export volumes weakens demand for the currency, reinforcing its commodity correlation. This direct link means that NZD/USD swing trading strategy using dairy export data isn’t just viable—it’s essential for traders seeking an edge in a market where macroeconomic noise often obscures true price drivers.
◈ GLOBAL DAIRY TRADE (GDT) AUCTIONS: THE PULSE OF THE KIWI DOLLAR
The fortnightly Global Dairy Trade (GDT) auctions are the most immediate fundamental catalyst for the Kiwi dollar. A price index rise of 2% or more typically triggers a knee-jerk rally in NZD/USD, while a drop of similar magnitude can accelerate bearish momentum. Traders integrating this data into their NZD/USD swing trading strategy using dairy export data should monitor the auction results in real-time, as the market often prices in expectations ahead of the release. Pairing this with the current strong bearish technical trend (price: 0.5790) allows for high-probability short setups when dairy prices disappoint.
◈ CHINA’S IMPORT DEMAND: THE 800-POUND GORILLA
China absorbs roughly 40% of New Zealand’s dairy exports, making its import data a critical input for any NZD/USD swing trading strategy using dairy export data. A sudden spike in Chinese dairy imports—often tied to inventory restocking or policy shifts—can send the Kiwi dollar surging, even in the face of broader USD strength. Conversely, a slowdown in Chinese demand can exacerbate bearish trends. Traders should cross-reference China’s customs data with technical levels (e.g., the current ATR of 0.0075) to gauge volatility expansion potential.
TOP 5 KIWI DOLLAR TRADING SIGNALS: DAIRY MEETS TECHNICALS
Combining dairy export data with technical analysis creates a robust framework for NZD/USD swing trading. Below are the top five signals that leverage this synergy, designed to exploit the commodity correlation while respecting the current strong bearish trend. Remember, in today’s algorithm-dominated markets, it’s also critical to understand how to detect algorithmic spoofing in Forex order books, as these tactics can distort key technical levels and lead to false breakouts.
◈ SIGNAL 1: GDT AUCTION BEAT + BREAK OF 0.5820 RESISTANCE
When the GDT price index rises by 3% or more, watch for a break above the 0.5820 resistance level (a key intraday pivot). This confluence of bullish fundamentals and technical confirmation can trigger a short-covering rally in the Kiwi dollar, offering a high-probability long entry for swing traders. Use the ATR (0.0075) to set a stop-loss just below the breakout candle, ensuring a risk-reward ratio of at least 1:2.
◈ SIGNAL 2: CHINESE IMPORT SLOWDOWN + BEARISH ENGULFING PATTERN
If China’s dairy import volumes drop by 10% or more month-over-month, wait for a bearish engulfing candle to form at the 0.5790 level. This dual confirmation—weak fundamentals plus technical exhaustion—can signal a continuation of the strong bearish trend toward the first take-profit target (TP1: 0.5492). Scale into the trade using the ATR to manage position sizing, as volatility may spike during the descent.
◈ SIGNAL 3: WHOLE MILK POWDER (WMP) PRICE DIVERGENCE + RSI OVERSOLD
Whole milk powder (WMP) is the most liquid dairy commodity and often leads the Kiwi dollar. If WMP prices rise by 5% while NZD/USD remains stagnant, watch for an RSI (14-period) dip below 30. This divergence—bullish fundamentals vs. oversold technicals—can precede a sharp mean-reversion rally. Enter long on the first bullish reversal candle, with a stop-loss below the recent swing low.
◈ SIGNAL 4: FONTERRA PAYOUT FORECAST UPGRADE + 50-DAY MA CROSS
Fonterra’s farmgate milk price forecast is a leading indicator for dairy export revenues. If Fonterra upgrades its payout forecast by 5% or more, monitor the 50-day moving average (MA). A bullish cross above this MA—especially if accompanied by rising WMP prices—can signal the start of a new uptrend in the Kiwi dollar. This is a classic NZD/USD swing trading strategy using dairy export data, where fundamentals validate the technical breakout.
◈ SIGNAL 5: SEASONAL DAIRY SUPPLY GLUT + HEAD-AND-SHOULDERS PATTERN
New Zealand’s dairy production peaks between October and December, often leading to a supply glut in Q1. If this seasonal trend coincides with a head-and-shoulders pattern forming on the daily chart, the Kiwi dollar is primed for a breakdown. The neckline of this pattern—often aligned with a key support level—can serve as the trigger for a short entry, with the ATR (0.0075) guiding stop-loss placement above the right shoulder.
RISK MANAGEMENT: PROTECTING YOUR KIWI DOLLAR SWING TRADES
No NZD/USD swing trading strategy using dairy export data is complete without rigorous risk management. The commodity correlation that makes the Kiwi dollar so tradable also exposes it to sudden shocks—whether from geopolitical tensions, weather disruptions, or algorithmic manipulation. Always use the ATR (0.0075) to size positions, ensuring no single trade risks more than 1-2% of your capital. For added protection, consider hedging with correlated commodities like wheat or soybeans, which can offset unexpected moves in dairy prices.
↔ Swipe to view
| SIGNAL TYPE | ENTRY TRIGGER | TAKE-PROFIT (TP1) |
|---|---|---|
| GDT Auction Beat + Resistance Break | Price > 0.5820 + GDT +3% | 0.5950 (1.5x ATR) |
| Chinese Import Slowdown + Bearish Engulfing | China imports -10% + Engulfing at 0.5790 | 0.5492 (TP1) |
| WMP Divergence + RSI Oversold | WMP +5% + RSI < 30 | 0.5850 (2x ATR) |
FINAL THOUGHTS: MASTERING THE KIWI DOLLAR’S COMMODITY CORRELATION
The Kiwi dollar’s commodity correlation with dairy exports is one of the most predictable drivers in the FX market, but only if traders respect the interplay between fundamentals and technicals. By integrating GDT auctions, Chinese import data, and seasonal trends into a NZD/USD swing trading strategy using dairy export data, you can exploit the currency’s inherent volatility while mitigating downside risk. Always remember: in a world where algorithms dominate, blending real-world data with technical precision is the key to consistent profits.
Conclusion
The NZD/USD swing trading strategy using dairy export data hinges on the commodity correlation between New Zealand’s agricultural exports and the Kiwi dollar. With the trend currently STRONG BEARISH and price at 0.5790, dairy-driven fundamentals will dictate near-term moves—any softening in export demand or global dairy prices risks accelerating the downside toward TP1 at 0.5492.
Trade the Kiwi dollar with precision: monitor dairy auction results, Fonterra updates, and cross-commodity trends. The ATR of 0.0075 signals tight volatility—use it to calibrate stops in this commodity correlation-driven NZD/USD swing trading strategy.
Frequently Asked Questions
How does dairy export data influence an NZD/USD swing trading strategy?
A robust NZD/USD swing trading strategy using dairy export data hinges on the commodity correlation between New Zealand’s agricultural exports—particularly dairy—and the Kiwi dollar. Dairy accounts for nearly 30% of New Zealand’s total exports, making it a critical driver of the country’s trade balance and, consequently, the Kiwi dollar’s valuation. When global dairy prices rise, demand for New Zealand’s exports increases, leading to higher foreign currency inflows. This strengthens the Kiwi dollar against the USD, creating opportunities for swing traders to capitalize on the upward momentum in the NZD/USD pair.
In the current context, with the NZD/USD exhibiting a STRONG BEARISH trend (price at 0.5790), traders should monitor dairy export data closely. A sudden uptick in dairy prices or export volumes could signal a potential reversal, offering a high-probability entry point for a NZD/USD swing trading strategy using dairy export data. Conversely, declining dairy prices may reinforce the bearish bias, validating short positions with a target at TP1 (0.5492).
What is the historical commodity correlation between the Kiwi dollar and agricultural exports?
The commodity correlation between the Kiwi dollar and New Zealand’s agricultural exports—especially dairy—is one of the most consistent relationships in forex markets. Historically, the NZD/USD pair has moved in tandem with global dairy prices, as New Zealand is the world’s largest exporter of whole milk powder. When dairy prices surge, the Kiwi dollar tends to appreciate due to improved terms of trade, while falling dairy prices often lead to Kiwi dollar depreciation.
For traders employing an NZD/USD swing trading strategy using dairy export data, this commodity correlation provides a reliable leading indicator. For example, if dairy export volumes or prices show signs of recovery, swing traders can anticipate a potential bounce in the Kiwi dollar, even in a broader bearish trend. Currently, with the NZD/USD in a STRONG BEARISH phase, monitoring dairy market developments is essential to identify inflection points.
How can traders integrate dairy export data into a NZD/USD swing trading strategy?
Integrating dairy export data into an NZD/USD swing trading strategy using dairy export data requires a structured approach that leverages the commodity correlation between agricultural exports and the Kiwi dollar. Here’s how traders can execute this effectively:
◈ MONITOR GLOBAL DAIRY PRICE INDICES
Track key benchmarks like the Global Dairy Trade (GDT) Price Index, which provides bi-weekly updates on dairy auction prices. A rising GDT index often precedes Kiwi dollar strength, while a declining index may signal further downside in the NZD/USD pair. Given the current STRONG BEARISH trend, traders should watch for divergences where dairy prices stabilize or rise while the NZD/USD remains weak, as this could indicate an impending reversal.
◈ ANALYZE NEW ZEALAND’S MONTHLY TRADE BALANCE REPORTS
New Zealand’s trade balance reports, released monthly by Stats NZ, provide granular data on dairy export volumes and values. A widening trade surplus—driven by higher dairy exports—typically supports the Kiwi dollar. Traders can use this data to confirm or challenge the prevailing trend. For instance, if the NZD/USD is in a downtrend but dairy exports are rising, it may present a contrarian swing trading opportunity.
◈ COMBINE WITH TECHNICAL ANALYSIS FOR HIGH-PROBABILITY ENTRIES
While dairy export data provides a fundamental edge, it should be paired with technical analysis to refine entry and exit points. For example, if dairy prices are rising and the NZD/USD forms a bullish reversal pattern (e.g., a hammer or engulfing candle) near a key support level, it strengthens the case for a long swing trade. Currently, with the price at 0.5790 and a STRONG BEARISH trend, traders should look for confirmation from both dairy data and technical indicators before entering a trade.
◈ RISK MANAGEMENT USING ATR
The Average True Range (ATR) of 0.0075 provides a quantitative measure of volatility for the NZD/USD pair. Traders can use this to set stop-loss levels that account for market noise. For example, a swing trader entering a long position based on improving dairy export data might place a stop-loss 1.5x the ATR (0.01125) below the entry price to avoid being stopped out by short-term fluctuations. This disciplined approach ensures that the NZD/USD swing trading strategy using dairy export data remains robust even in volatile conditions.
📂 Associated Market Intelligence
- ◈Best Forex trading strategies for beginners in volatile markets
- ◈How to trade EUR/USD during ECB press conferences
- ◈USD/JPY carry trade strategy with Bank of Japan rates
- ◈Trading USD/CAD correlation with WTI crude oil prices
- ◈How to trade exotic currency pairs with low liquidity
- ◈GBP/USD trading strategy for the London session open
- ◈How to use a Forex correlation matrix to hedge risk
- ◈How to trade Non-Farm Payrolls (NFP) data in Forex
- ◈How to calculate pip value and lot size for risk management
- ◈How to use the COT report for Forex swing trading
- ◈How to use the DXY Dollar Index to trade major Forex pairs
- ◈How to trade the Asian session kill zone in Forex
- ◈Central Bank monetary policy divergence strategy in Forex
- ◈How to trade Forex liquidity voids and Fair Value Gaps (FVG)
- ◈How to trade CHF and JPY during global geopolitical crises
- ◈A-Book vs B-Book Forex Brokers: What retail traders must know
- ◈How to trade Forex options and understand the volatility smile
- ◈How to detect algorithmic spoofing in Forex order books
- ◈How to protect your Forex account from liquidity flash crashes
⚖️ REGULATORY DISCLOSURE & RISK WARNING
The trading strategies and financial insights shared here are for educational and analytical purposes only. Trading involves significant risk of loss and is not suitable for all investors. Past performance is not indicative of future results.