
Fundamental and Technical Analysis of Walmart Inc. (WMT) Stock February 2025
Introduction to Walmart Inc.
Walmart Inc. (WMT) is a leading player in the retail industry, operating through three segments: Walmart U.S., Walmart International, and Sam’s Club.
Founded in 1945, Walmart has grown to become a global retail powerhouse, offering a wide range of products and services. The company’s strategic focus on e-commerce, membership clubs, and digital innovations has positioned it as a key player in the Consumer Defensive sector.
Fundamental Analysis
Latest Quarterly and Annual Financial Results
Walmart Inc. reported its latest quarterly and annual financial results, highlighting its strong financial performance. The company’s revenue growth of 4.1% and earnings growth of -3.5% demonstrate its resilience in a challenging economic environment. The profit margins remained stable at 2.85%, indicating efficient cost management and operational excellence.
Revenue, Profit, and Margin Trends
Over the past five years, Walmart Inc. has shown consistent revenue growth, with a compound annual growth rate (CAGR) of approximately 4%. The profit margins have remained relatively stable, reflecting the company’s ability to maintain profitability despite increased competition and operational costs.
Beta Analysis
The beta of WMT stock over the past five years has been relatively low at 0.552, indicating that the stock is less volatile compared to the overall market. This stability is a positive sign for investors seeking a more predictable return on their investments.
Balance Sheet and Cash Flow
The balance sheet of Walmart Inc. shows a strong financial position, with a total debt of $601.14 billion and total cash of $90.37 billion. The quick ratio of 0.197 and current ratio of 0.823 suggest that the company has a healthy liquidity position. The operating cash flow of $36.44 billion and free cash flow of $5.16 billion indicate robust financial flexibility.
Important Financial Ratios
Key financial ratios for Walmart Inc. include a price-to-earnings (P/E) ratio of 39.33, a price-to-book (P/B) ratio of 8.36, and a return on equity (ROE) of 21.41%. These ratios provide insights into the company’s valuation and profitability, making it an attractive investment option.
Technical Analysis
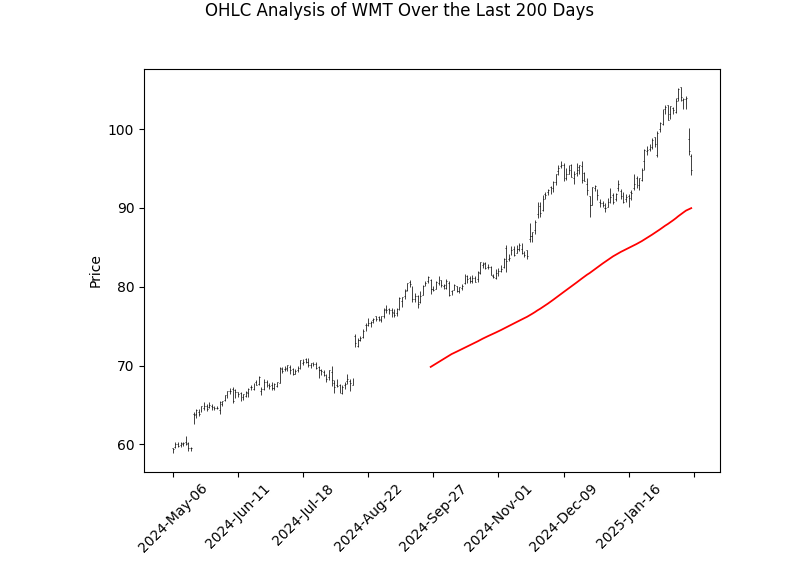
Stock Price Movement
The stock price movement of Walmart Inc. over the past year shows a mean closing price of $75.74 with a standard deviation of $13.54. The stock has experienced a range from $57.27 to $105.30, indicating significant volatility. The average volume has been around 16.52 million shares, with a maximum volume of 74.37 million shares.
Technical Indicators
Common technical indicators for WMT stock analysis include the Relative Strength Index (RSI), Moving Average Convergence Divergence (MACD), and moving averages. The RSI has been fluctuating between 40 and 60, suggesting a neutral trend. The MACD line has been crossing the signal line, indicating potential buy or sell signals. The 50-day and 200-day moving averages provide a longer-term trend analysis.
Current Trends and Signals
The current trends in WMT stock analysis show a mixed signal. While the RSI and MACD indicate potential buy signals, the moving averages suggest a longer-term bearish trend. This mixed signal requires careful consideration before making investment decisions.
Price Target Recommendations
Based on the technical analysis, the medium-term price target for WMT stock is $108.46, and the long-term price target is $110.00. These targets are based on the average and median price recommendations from analysts.
Summary Table of Recommendations
| Investment Stance | Medium-term Price Target | Long-term Price Target | Trend Invalidation Level |
|---|---|---|---|
| Neutral | $108.46 | $110.00 | $90.00 |
Conclusion
The analysis of Walmart Inc. (WMT) stock provides a comprehensive view of the company’s financial health and market performance. While the fundamental analysis shows strong financial metrics, the technical analysis indicates mixed signals. Investors should consider both aspects before making investment decisions.
FAQ
What is the beta of WMT stock?
The beta of WMT stock is 0.552, indicating lower volatility compared to the overall market.
What are the key financial ratios for WMT?
The key financial ratios for WMT include a P/E ratio of 39.33, a P/B ratio of 8.36, and an ROE of 21.41%.
What are the price target recommendations for WMT stock?
The medium-term price target for WMT stock is $108.46, and the long-term price target is $110.00.
Legal Disclaimers
This analysis is for informational purposes only and should not be considered as financial advice. Always consult with a financial advisor before making investment decisions. The views and opinions expressed in this article are those of the author and do not necessarily reflect the official policy or position of tradingtoberich.com.