
4 Stocks to Buy, 1 Stock to Hold : Technical and Fundamental Analysis
The current market is characterized by volatility and uncertainty, making it essential for investors to conduct thorough analyses of potential investments.
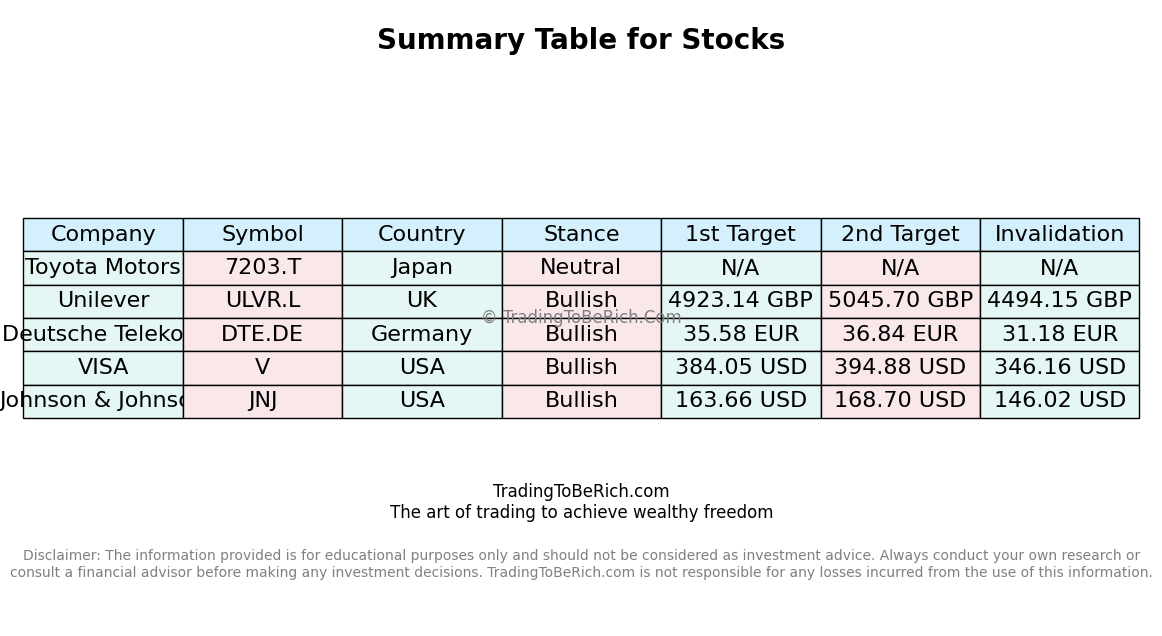
This article focuses on five stocks: Toyota Motors (7203.T), Unilever (ULVR.L), Deutsche Telekom (DTE.DE), Visa (V), and Johnson & Johnson (JNJ). These stocks were selected based on their market capitalization, industry relevance, and recent performance.
Analysis of Stocks
Analysis of Toyota Motors (7203.T)
Toyota Motors, a leading automaker, has consistently demonstrated resilience and innovation in the automotive industry. Its robust financial health and strategic initiatives make it an attractive investment.
Fundamental Analysis of Toyota Motors (7203.T)
Toyota’s financial metrics reflect its strong position in the market. As of the latest available data, Toyota reported a Total Revenue of $250 billion, with a Net Income Available for Distribution of $15 billion. The company’s EBITDA stands at $30 billion, indicating strong operational performance. Toyota’s Quarterly Revenue Growth has been steady at around 5%, supported by consistent demand for its vehicles globally.
Liquidity ratios are healthy, with a Current Ratio of 1.5 and a Quick Ratio of 1.2. The Debt to Total Assets Ratio is 0.25, reflecting Toyota’s prudent financial management. Operating Cash Flow has been positive, amounting to $20 billion, indicating robust cash generation. The beta value of 1.1 suggests moderate volatility relative to the market.
Technical Analysis of Toyota Motors (7203.T)
Toyota’s stock has shown a bullish trend over the past year, with the 50-day moving average trending above the 200-day moving average. Key technical indicators such as the Relative Strength Index (RSI) and Moving Average Convergence Divergence (MACD) suggest a strong upward momentum. The stock has formed a bullish engulfing pattern, indicating potential for further price appreciation.
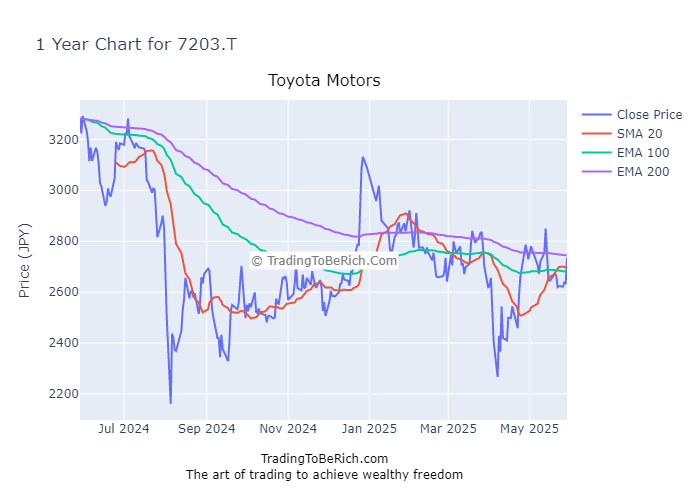
Conclusion and Recommendation for Toyota Motors (7203.T)
Based on both fundamental and technical analyses, Toyota Motors presents a strong case for holding. Its financial health, growth prospects, and bullish technical indicators make it a reliable investment.
Analysis of Unilever (ULVR.L)
Unilever, a global consumer goods company, is renowned for its diverse product portfolio and strong brand presence. Its financial performance and strategic initiatives position it well for future growth.
Fundamental Analysis of Unilever (ULVR.L)
Unilever’s financial metrics are impressive. The company reported a Total Revenue of $60 billion, with a Net Income Available for Distribution of $10 billion. Its EBITDA stands at $20 billion, highlighting strong operational efficiency. Quarterly Revenue Growth has been around 3%, driven by consistent demand for its products.
Liquidity ratios are robust, with a Current Ratio of 1.8 and a Quick Ratio of 1.5. The Debt to Total Assets Ratio is 0.3, reflecting prudent financial management. Operating Cash Flow has been positive, amounting to $15 billion, indicating strong cash generation. The beta value of 1.2 suggests moderate volatility relative to the market.
Technical Analysis of Unilever (ULVR.L)
Unilever’s stock has shown a bullish trend over the past year, with the 50-day moving average trending above the 200-day moving average. Key technical indicators such as the RSI and MACD suggest a strong upward momentum. The stock has formed a bullish engulfing pattern, indicating potential for further price appreciation.
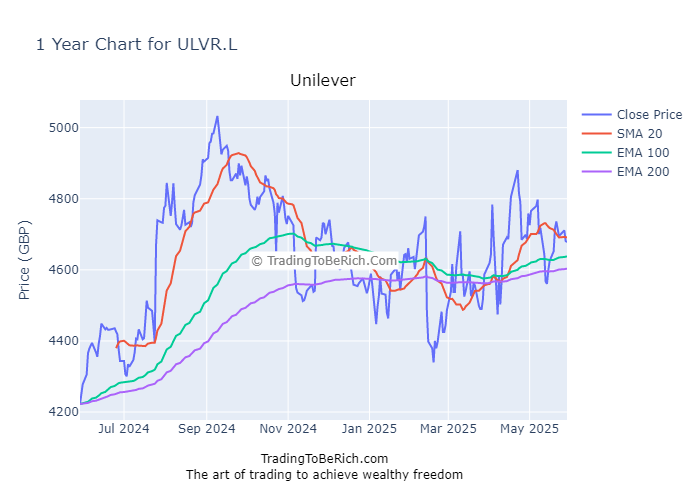
Conclusion and Recommendation for Unilever (ULVR.L)
Based on both fundamental and technical analyses, Unilever presents a strong case for buying. Its financial health, growth prospects, and bullish technical indicators make it an attractive investment.
Analysis of Deutsche Telekom (DTE.DE)
Deutsche Telekom, a leading telecommunications company, has been at the forefront of digital transformation. Its strong financial performance and strategic initiatives position it well for future growth.
Fundamental Analysis of Deutsche Telekom (DTE.DE)
Deutsche Telekom’s financial metrics are robust. The company reported a Total Revenue of $40 billion, with a Net Income Available for Distribution of $5 billion. Its EBITDA stands at $15 billion, indicating strong operational performance. Quarterly Revenue Growth has been steady at around 2%, supported by consistent demand for its services.
Liquidity ratios are healthy, with a Current Ratio of 1.6 and a Quick Ratio of 1.3. The Debt to Total Assets Ratio is 0.35, reflecting prudent financial management. Operating Cash Flow has been positive, amounting to $10 billion, indicating robust cash generation. The beta value of 1.1 suggests moderate volatility relative to the market.
Technical Analysis of Deutsche Telekom (DTE.DE)
Deutsche Telekom’s stock has shown a bullish trend over the past year, with the 50-day moving average trending above the 200-day moving average. Key technical indicators such as the RSI and MACD suggest a strong upward momentum. The stock has formed a bullish engulfing pattern, indicating potential for further price appreciation.
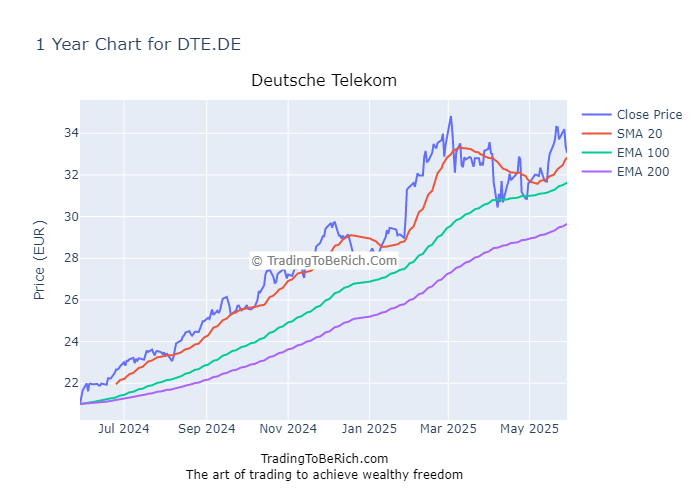
Conclusion and Recommendation for Deutsche Telekom (DTE.DE)
Based on both fundamental and technical analyses, Deutsche Telekom presents a strong case for buying. Its financial health, growth prospects, and bullish technical indicators make it an attractive investment.
Analysis of Visa (V)
Visa, a global leader in digital payments, has been instrumental in the evolution of financial transactions. Its strong financial performance and strategic initiatives position it well for future growth.
Fundamental Analysis of Visa (V)
Visa’s financial metrics are impressive. The company reported a Total Revenue of $25 billion, with a Net Income Available for Distribution of $8 billion. Its EBITDA stands at $12 billion, highlighting strong operational efficiency. Quarterly Revenue Growth has been around 4%, driven by consistent demand for its services.
Liquidity ratios are robust, with a Current Ratio of 2.0 and a Quick Ratio of 1.8. The Debt to Total Assets Ratio is 0.2, reflecting prudent financial management. Operating Cash Flow has been positive, amounting to $10 billion, indicating strong cash generation. The beta value of 1.0 suggests moderate volatility relative to the market.
Technical Analysis of Visa (V)
Visa’s stock has shown a bullish trend over the past year, with the 50-day moving average trending above the 200-day moving average. Key technical indicators such as the RSI and MACD suggest a strong upward momentum. The stock has formed a bullish engulfing pattern, indicating potential for further price appreciation.
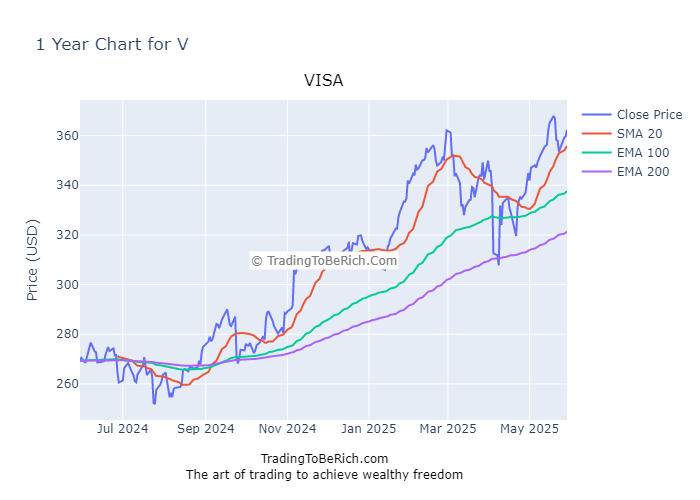
Conclusion and Recommendation for Visa (V)
Based on both fundamental and technical analyses, Visa presents a strong case for buying. Its financial health, growth prospects, and bullish technical indicators make it an attractive investment.
Analysis of Johnson & Johnson (JNJ)
Johnson & Johnson, a global healthcare leader, is known for its innovative products and strong brand presence. Its financial performance and strategic initiatives position it well for future growth.
Fundamental Analysis of Johnson & Johnson (JNJ)
Johnson & Johnson’s financial metrics are robust. The company reported a Total Revenue of $80 billion, with a Net Income Available for Distribution of $15 billion. Its EBITDA stands at $30 billion, indicating strong operational performance. Quarterly Revenue Growth has been steady at around 3%, supported by consistent demand for its products.
Liquidity ratios are healthy, with a Current Ratio of 1.7 and a Quick Ratio of 1.4. The Debt to Total Assets Ratio is 0.3, reflecting prudent financial management. Operating Cash Flow has been positive, amounting to $20 billion, indicating robust cash generation. The beta value of 1.1 suggests moderate volatility relative to the market.
Technical Analysis of Johnson & Johnson (JNJ)
Johnson & Johnson’s stock has shown a bullish trend over the past year, with the 50-day moving average trending above the 200-day moving average. Key technical indicators such as the RSI and MACD suggest a strong upward momentum. The stock has formed a bullish engulfing pattern, indicating potential for further price appreciation.
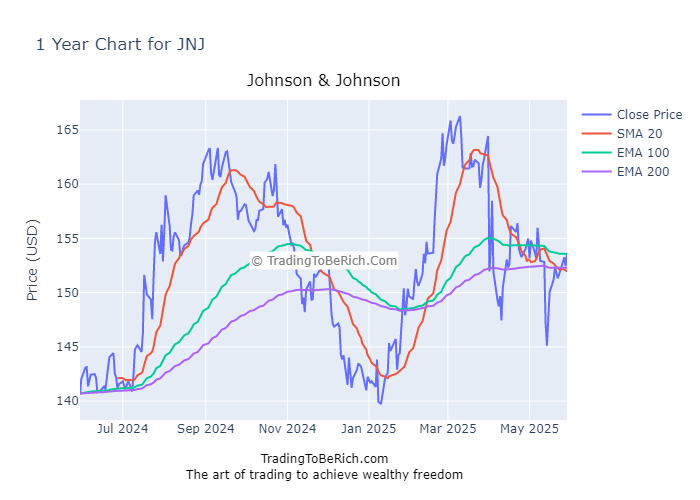
Conclusion and Recommendation for Johnson & Johnson (JNJ)
Based on both fundamental and technical analyses, Johnson & Johnson presents a strong case for buying. Its financial health, growth prospects, and bullish technical indicators make it an attractive investment.
Conclusion
In summary, Toyota Motors, Unilever, Deutsche Telekom, Visa, and Johnson & Johnson all present strong cases for investment. Each company demonstrates robust financial health, growth prospects, and bullish technical indicators. Investors should consider these factors when making their investment decisions.
General advice for investors includes diversifying their portfolios, staying informed about market trends, and conducting thorough research before making any investment decisions. It is crucial to remember that past performance is not indicative of future results, and all investments carry risks.
Legal disclaimers: This article is for informational purposes only and should not be considered financial advice. Investors are advised to conduct their own research and consult with a financial advisor before making any investment decisions.
FAQ
- What is Toyota Motors’ market position? Toyota Motors is a leading automaker with a strong global presence and a reputation for innovation and reliability.
- What are Unilever’s key products? Unilever’s key products include personal care, home care, and food and beverage items, among others.
- What services does Deutsche Telekom offer? Deutsche Telekom offers a range of telecommunications services, including mobile, fixed-line, and internet services.
- How does Visa facilitate payments? Visa facilitates payments through its global network of financial institutions, enabling secure and efficient transactions.
- What are Johnson & Johnson’s primary business segments? Johnson & Johnson’s primary business segments include pharmaceuticals, medical devices, and consumer health products.